Our teacher has shared our learning intentions with us. By the end of this week we will be able to:
- Pose questions for investigation
- Collect category data
- Display data in tally charts, uniform pictograms & bar charts
- Make statements about data displays
- Collect data looking for trends and talking about these using evidence (what the data shows).
Here is the first session where Mrs C introduced us to statistics, what it is all about and how to gather information.
 |
| We couldn't remember much about statistics from earlier years at school. It has been a long time between graphs! |
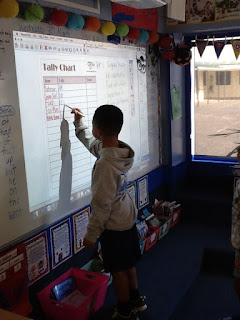
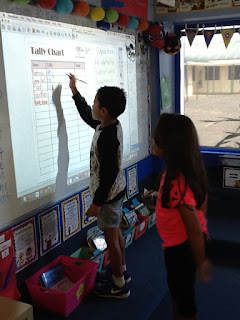
We decided to find out which Superhero is Room 2's favourite. Here are photos of some of us filling out a tally chart:


This is what our tally chart looked like at the end. You can see some of the questions that Mrs C asked us about the data. Keep checking back to see us carrying out our own statistical investigations. Ask us about what we have been learning and what we found out!


No comments:
Post a Comment